specsr
Physics-informed deep learning for super-resolving galaxy spectra.
specsr enhances low-resolution galaxy spectra by a factor of ~10 in resolving
power (R~100 → R~1000), recovering narrow emission-line features — including
blended doublets such as [O III] λλ4959,5007 and Hβ — that are entirely
unresolvable at prism resolution.
The model is trained on paired JWST/NIRSpec observations from JADES, where each galaxy contributes a low-resolution prism spectrum and a stitched medium-resolution grating reference.
Reference
Haghjoo, A., Hemmati, S., Mobasher, B., et al. Learning to See Sharper: A Physics-Informed Artificial Intelligence Framework for Super-Resolving Galaxy Spectra. arXiv:2603.18357
Quickstart
from specsr.inference import SpecSRPipeline

pipeline = SpecSRPipeline.from_pretrained()      # weights fetched from the Hub
result = pipeline(flux_low, wavelength_low)      # your own wavelength grid

result.sr1         # super-resolved spectrum
result.sr2         # after physics-informed line refinement
result.sr2_sigma   # wavelength-dependent predictive uncertainty
result.z           # inferred redshift, with result.z_sigma
result.wavelength  # the HR grid, in microns
Pass wavelength_low unless your spectrum is already on pipeline.wavelength:
the input is then resampled onto the model’s grid by integration rather than
interpolation, so line flux is preserved by construction.
The model does not predict absolute flux scale
Training standardises each spectrum independently, so what the model learns is a mapping from shape to shape. Output is returned on the input’s scale, which is not the true high-resolution spectrum’s scale — a median factor of ~4 apart on validation data, and past 40 on individual objects.
The returned arrays are self-consistent within one spectrum. Comparing them against a real grating spectrum, or across objects, requires standardising both sides first — which is why every figure in the paper is labelled $F_\lambda$ (normalized).
New here? The tutorials are three executable notebooks with real spectra bundled, and they run with no survey data.
How it works
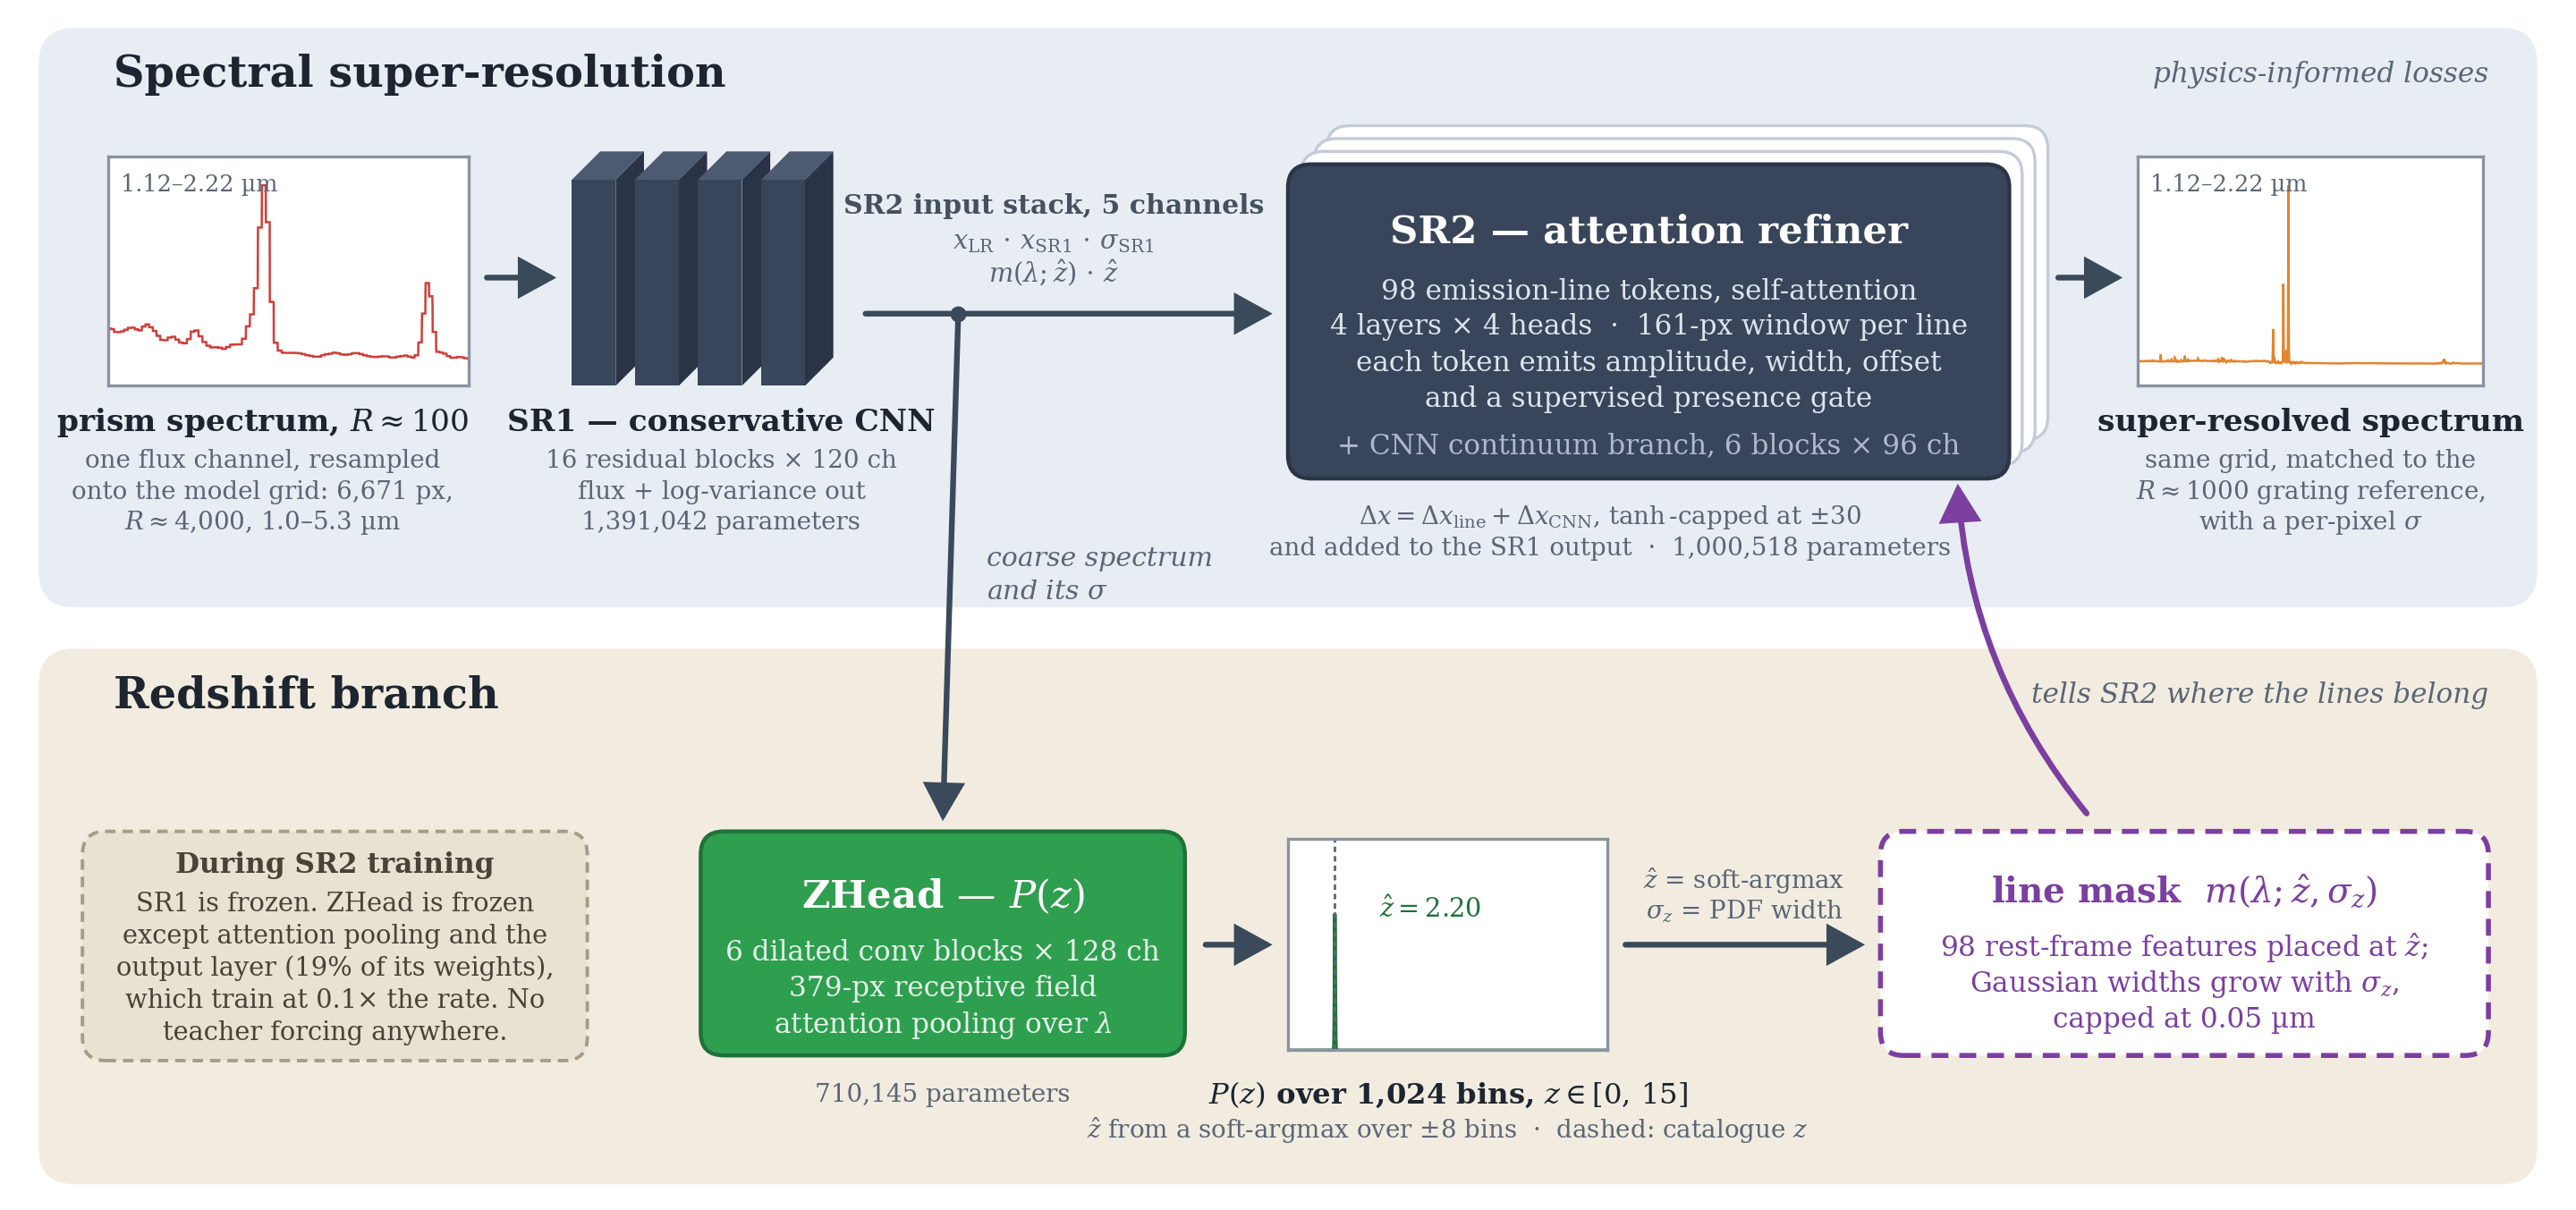
Three stages, trained in sequence, each freezing the one before it: SR1, a 1D residual CNN backbone that maps the prism spectrum to a grating-like reconstruction with a per-pixel variance; ZHead, which infers a redshift from SR1’s output as a distribution over 1,024 bins; and SR2, which refines the result with attention over 98 emission-line tokens placed at the predicted redshift, plus a CNN continuum branch.
Every number on the diagram is read off the released checkpoints at draw time, and its inset panels are real predictions for a held-out galaxy.
Guides
Reference
- API reference
- specsr.inference.pipeline
- specsr.paths
- specsr.checkpoints
- specsr.config
- specsr.runtime
- specsr.metrics
- specsr.linefit
- specsr.data.grid
- specsr.data.augment
- specsr.data.build
- specsr.data.ingest
- specsr.data.stitch
- specsr.data.datasets
- specsr.data.splits
- specsr.models.blocks
- specsr.models.sr1
- specsr.models.zhead
- specsr.models.sr2
- specsr.models.lines
- specsr.training.losses
- specsr.training.ztransform
- specsr.training.zhead_sources
- Changelog